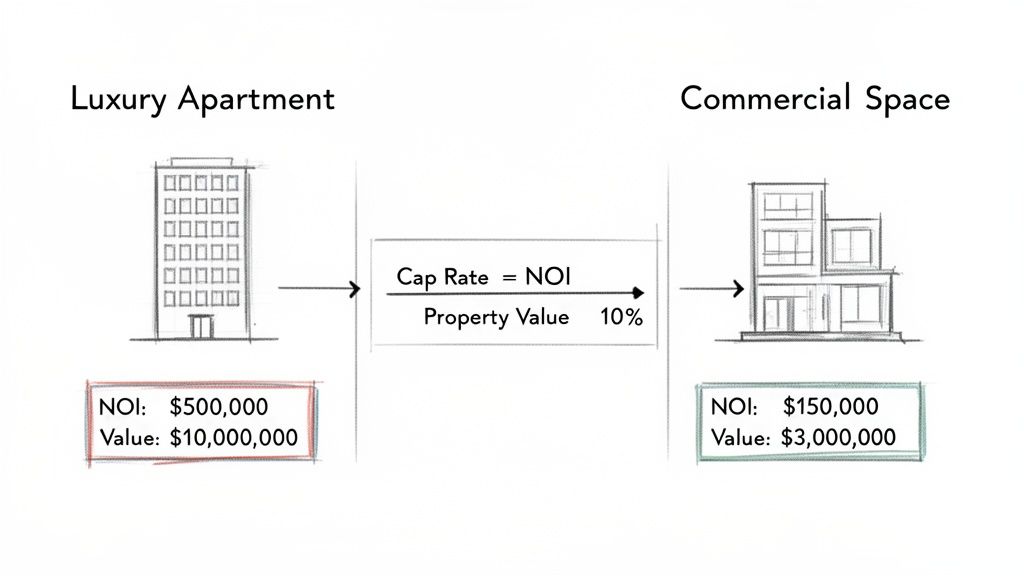
At the heart of any serious real estate investment is the cap rate formula: a property's Net Operating Income (NOI) divided by its current Market Value. This straightforward calculation provides a powerful, unfiltered look at a property's potential return on investment before factoring in any debt.
For investors, mastering the cap rate formula is essential. It’s the go-to metric for comparing different commercial real estate assets, understanding property valuation, and getting a quick check on profitability.
What The Cap Rate Formula Really Tells You
For high-net-worth investors and the family offices that advise them, the capitalization rate is far more than just a number—it’s a fundamental tool for making strategic real estate investments. Think of it as the financial heartbeat of a property. It reveals the raw, unleveraged rate of return you could expect in the first year if you bought the asset with cash.
What makes this formula so useful is its simplicity. This single percentage strips away the complexities of financing and focuses purely on the property's innate ability to generate income relative to its market value. This creates a level playing field, allowing you to compare a downtown office tower in New York with a multifamily complex in Austin on a true apples-to-apples basis.
Why You Can't Ignore The Cap Rate
Getting comfortable with the cap rate formula is non-negotiable because it immediately informs your most critical investment questions:
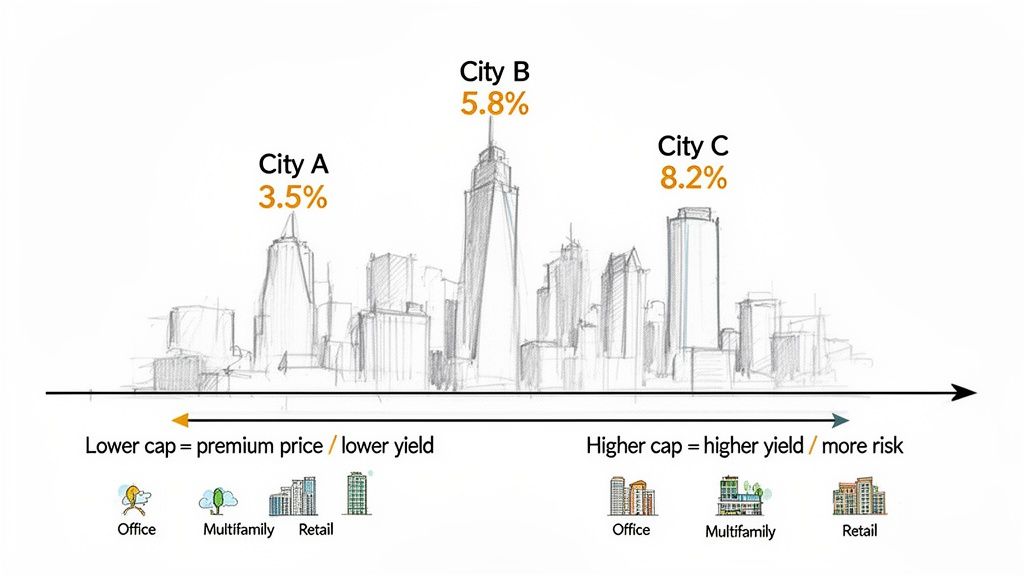
- Profitability Snapshot: It’s the quickest way to gauge a property's income-generating potential. A higher cap rate generally implies a higher potential return.
- Risk Assessment: A higher cap rate often hints at higher perceived risk, while a lower cap rate suggests you're looking at a safer, more stable asset in a prime location.
- Market Comparison: It helps you efficiently compare different properties and markets, flagging opportunities that might be undervalued or overpriced.
- Valuation Tool: You can also flip the formula around to estimate a property's value based on its income and the prevailing cap rate for similar assets. To go deeper on this, it's worth exploring the different methods used in how to value commercial real estate.
This is often the very first number a seasoned real estate investor looks at. Say you have a property generating $100,000 in NOI with a $2,000,000 price tag. That’s a 5% cap rate. Now, imagine another property with the same $100,000 NOI but a $1,250,000 price. That one has an 8% cap rate. The difference immediately tells a story about value, risk, and potential upside.
The cap rate formula provides an essential baseline for any serious property analysis. It cuts through the noise and reveals the core relationship between a property's income and its cost, forming the foundation of a sound investment thesis.
To fully appreciate its role, you have to see where it fits among the various real estate property valuation methods. While metrics like cash-on-cash return are crucial for understanding your personal returns on a leveraged deal, the cap rate evaluates the asset itself—making it an indispensable part of your analytical toolkit.
Calculating Net Operating Income: The Heart Of The Formula
The cap rate formula is only as good as its inputs, and there's no input more important than Net Operating Income (NOI). Think of NOI as the property's pure, unadulterated profit before you even think about the mortgage or income taxes.
Getting this number right is everything. A sloppy NOI calculation can make a bad deal look great—or a great deal look mediocre—completely skewing your perception of its true potential. To do it properly, you have to cut through the optimistic "pro forma" numbers you often see in a sales brochure and get to the real, hard figures.
Start With Gross Potential Income
First things first, you need to figure out the property's Gross Potential Income (GPI). This is a simple, best-case-scenario number: what’s the maximum revenue the building could possibly generate if it were 100% occupied all year, with every single tenant paying every dime on time?
For any multifamily or commercial building, this starts with the rent roll. You can dig deeper into how to analyze a property's income by reviewing our guide on what is a rent roll. GPI should include not just the base rent, but also any other income streams like parking fees, laundry machines, or storage units.
Adjust For Real-World Losses
Of course, no property is ever 100% full with perfectly paying tenants. Life just doesn't work that way. The next step is to bring your GPI back down to earth by accounting for vacancy and credit loss.
Vacancy is the income you lose from empty units, while credit loss is for tenants who don't pay their rent. Subtracting these from your GPI gives you the Effective Gross Income (EGI), a much more honest picture of the cash actually coming in the door.
Effective Gross Income (EGI) = Gross Potential Income - Vacancy & Credit Loss
Let’s say a luxury apartment building has a GPI of $500,000. If it historically runs a 5% rate for vacancies and non-payment, its EGI would be $475,000 ($500,000 - $25,000). That’s the number you work from.
This simple diagram shows how a property's income and value are weighed against each other to produce the cap rate.
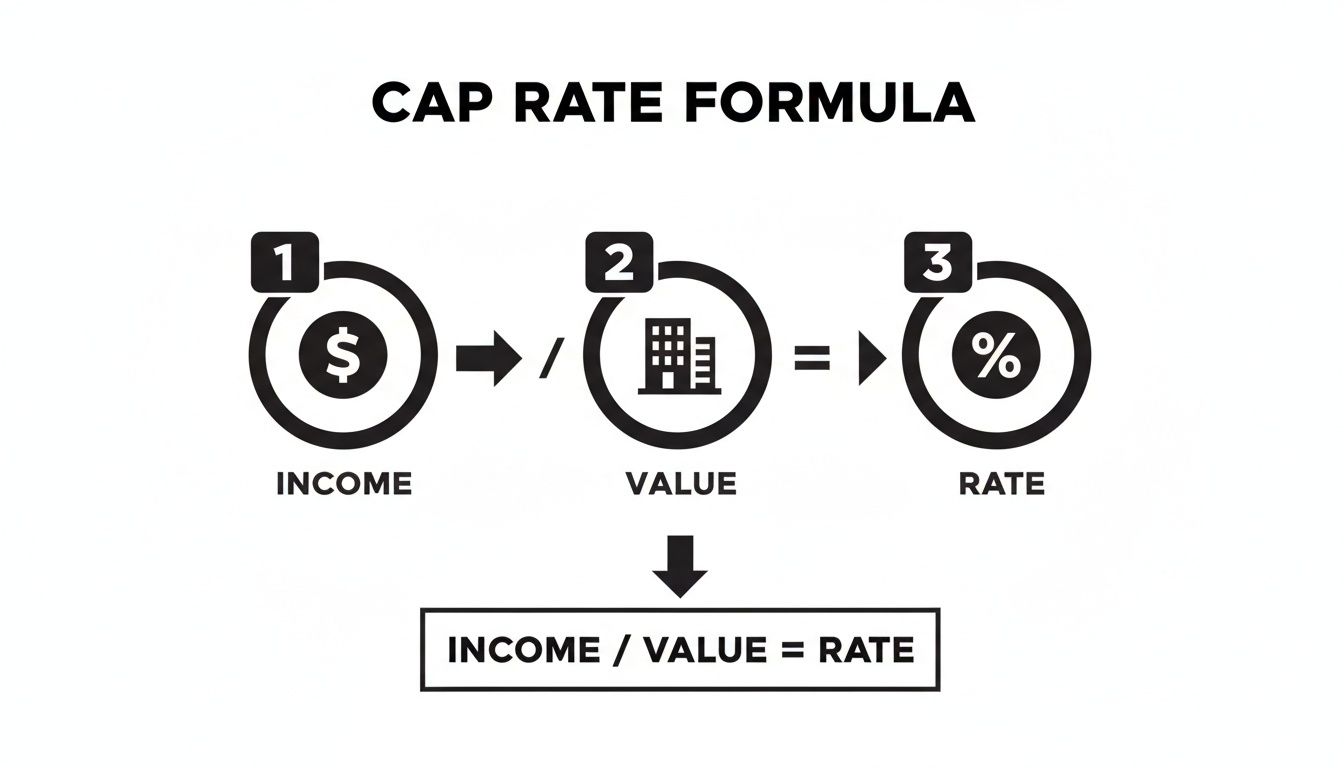
It’s all about the relationship between what the asset earns and what it’s worth.
Subtracting The Right Operating Expenses
Now for the final step to get your NOI: subtracting all the necessary operating expenses from the EGI. These are the costs required to simply keep the lights on and the property running day-to-day. The trick here is knowing exactly what counts as an operating expense—and what doesn’t.
What to Include in Operating Expenses:
- Property Taxes: The annual bill from the city or county.
- Insurance: Premiums for property and liability coverage.
- Utilities: Any water, sewer, trash, or common area electricity paid by the owner.
- Repairs & Maintenance: The ongoing costs of upkeep—landscaping, plumbing fixes, painting, etc.
- Management Fees: What you pay a property manager, usually a percentage of EGI.
What to Exclude from Operating Expenses:
- Debt Service: This is the big one. Mortgage payments (principal and interest) are never included. The cap rate measures the property's performance independent of financing.
- Capital Expenditures (CapEx): Major, one-off projects like a new roof or HVAC system. These are handled separately from day-to-day operations.
- Depreciation: An accountant's tool for tax purposes, not a real cash expense.
- Tenant-Specific Improvements: Custom build-out costs for a new commercial tenant.
By carefully subtracting only the true operating costs, you arrive at a clean NOI. This number is the bedrock of your analysis, reflecting the property's raw ability to generate profit and allowing for a truly accurate cap rate calculation.
A Step-By-Step Guide To Using The Cap Rate Formula
Alright, now that we have a solid handle on Net Operating Income (NOI) and property value, the cap rate formula stops being an abstract concept and becomes a powerful, hands-on tool for sizing up a deal. Walking through a few real-world examples is the best way to see how the math actually works and what it tells you about a potential investment.
Let’s crunch the numbers on a couple of properties you might see in a high-net-worth portfolio. This will help you get comfortable not just with the calculation, but with what the final number really means.
Scenario 1: The Luxury Apartment Building
Picture a high-end, 50-unit apartment building in a hot urban neighborhood. The property is stabilized—meaning it has consistent, high occupancy—which makes it a perfect candidate for a clean cap rate analysis.
First, we need our two key figures:
- Property Value: The seller’s asking price for the building is $10,000,000.
- Net Operating Income (NOI): After digging into the financials, you’ve calculated a realistic annual NOI of $550,000.
Now, let's plug those numbers into the formula:
Cap Rate = Net Operating Income / Property Value
Cap Rate = $550,000 / $10,000,000
Cap Rate = 0.055 or 5.5%
The result is a cap rate of 5.5%. For a top-tier Class A property in a prime location, this number points to a lower-risk, stable investment. That’s often exactly what conservative investors are looking for—wealth preservation with a side of steady returns.
Scenario 2: The Prime Commercial Space
Next up, let’s look at a multi-tenant commercial building in a bustling business district. This property has a mix of retail shops and office tenants, all on long-term leases. Here are the financials:
- Property Value: The current market value is pegged at $7,500,000.
- Net Operating Income (NOI): The combined rent roll, minus all operating expenses, generates an annual NOI of $562,500.
Let's run the numbers again:
- Start with the NOI: $562,500
- Use the Property Value: $7,500,000
- Divide NOI by Property Value: $562,500 / $7,500,000 = 0.075
- Convert to a Percentage: 0.075 x 100 = 7.5%
This time, the cap rate comes out to 7.5%—quite a bit higher than the luxury apartment building. What does that tell us? The market is pricing in a higher potential return, which could be tied to different risks, like the chance of tenant turnover or the overall health of the commercial sector.
To see this in action, the table below shows how different inputs can change the final cap rate across various asset types.
Cap Rate Calculation Scenarios
As you can see, higher-risk or less-prime properties often command higher cap rates to compensate investors for taking on that additional uncertainty.
Using The Formula In Reverse For Valuation
Here’s where the cap rate formula really shows its versatility. You can flip it around to determine a property’s value based on a target return, not just calculate the rate on a known price.
Let's say you know that similar commercial properties in your target market are trading at an average 7% cap rate. You've analyzed a potential deal and figured out its stabilized NOI is $420,000.
To figure out what you should be willing to pay, just rearrange the formula:
- Property Value = NOI / Cap Rate
- Property Value = $420,000 / 0.07
- Property Value = $6,000,000
This quick calculation tells you that a fair market price for this property, based on current market sentiment, is $6,000,000. If the seller is asking $7 million, the formula is an immediate red flag that the property might be overpriced compared to its income and what the rest of the market is paying. This simple inversion transforms the cap rate from a passive metric into an active valuation tool you can use to make offers and negotiate with confidence.
Interpreting Cap Rates: What Is A Good Cap Rate?
After you've run the numbers with the cap rate formula, you’re left with a percentage. The immediate question is always the same: is that any good?
Honestly, there’s no single “good” cap rate. A 5% cap rate might be a fantastic deal for a trophy property in downtown Manhattan, but it could be a terrible one for an aging building in a small, secondary market.
Context is everything. A cap rate isn’t just a simple return metric; it’s a snapshot of risk, growth potential, and market sentiment all wrapped into one number. Getting this is what separates the novices from the pros.
Key Factors That Shape Cap Rates
So, what determines if a cap rate is high or low? A few powerful forces are always at play, creating a delicate balance between a property’s unique profile and the wider economic landscape.
The main drivers include:
- Geographic Location: A building in a red-hot market like Austin will trade at a much lower cap rate than a similar property in a quieter Midwest town. Investors are willing to pay a premium—and accept a lower initial yield—for the stability and appreciation potential they believe a top-tier location offers.
- Property Type and Class: A brand-new Class A apartment complex with stable, long-term tenants is considered a safe bet. It’s far less risky than a Class C retail strip with a handful of mom-and-pop shops on short leases. Because of that lower risk, the apartment building will command a much lower cap rate.
- Economic Climate: The broader economy, especially interest rates, has a huge influence. When rates are low, borrowing is cheap and real estate looks attractive, which pushes property prices up and cap rates down. When rates climb, investors demand higher returns to compensate for the higher cost of capital, and cap rates tend to rise with them.
A cap rate is the market’s consensus on the relationship between risk and return for a specific property at a specific moment. It tells you what other investors are willing to pay for a dollar of net operating income.
Cap Rate Compression and Expansion
The real estate market is always moving, and cap rates are a great way to track the cycles. The cap rate formula, a valuation cornerstone since the 1970s, clearly shows how economic shifts impact property values.
Take the period from 2001 to 2007. Low interest rates and a flood of capital pushed office cap rates from around 10% down to 5.5%. Apartment cap rates fell from 8.5% to just 6%. At the absolute peak of the market, iconic deals like New York’s Stuyvesant Town sold at a razor-thin 3.1% cap rate. This perfectly illustrates the inverse relationship: as cap rates compress, property values soar.
To get a real-world feel for this, it’s worth looking at the best Airbnb markets with high cap rates. These areas often deliver higher initial returns but come with a completely different set of operational headaches and market risks compared to traditional long-term rentals.
Ultimately, a "good" cap rate is one that fairly compensates you for the risk you're taking on. It has to fit your strategy—whether you’re hunting for stable cash flow or you’re willing to accept a lower initial return for a shot at massive appreciation in a high-growth market.
Advanced Applications: The Cap Rate Formula And Growth
For seasoned investors, the cap rate formula is a lot more than a static snapshot of a property today. It's a powerful lens for looking into the future. Used correctly, it can reveal what the market is baking in for income growth, turning a simple yield calculation into a forward-looking indicator of an asset’s true potential.
This is the key to understanding valuations in prime, high-growth markets. It answers the question I hear all the time: why would a savvy investor ever accept a seemingly low cap rate of 4% or 5%? The answer, almost always, is the expectation of future Net Operating Income (NOI) growth.
The Growth-Adjusted Cap Rate Formula
At a higher level, the cap rate is directly tied to an investor's required rate of return (the discount rate) and the property's expected growth. This relationship is best captured by a classic financial model:
Cap Rate = Discount Rate - Expected NOI Growth Rate
This formula completely reframes the conversation. A low cap rate doesn't just mean a high price. It implies the market believes significant future growth is coming and has already priced it in. Investors are willing to pay a premium today because they anticipate the property's income will climb over time, delivering a much stronger total return down the road.
Take a property in a booming tech hub, for example, that trades at a 4.5% cap rate. That isn’t because investors are happy with a low initial yield. It’s because they’re projecting that rents—and therefore NOI—in that specific submarket are going to grow by 3-4% annually for the foreseeable future. This dynamic is a core principle of successful investment management in real estate.
How Growth Justifies A Lower Cap Rate
Let's walk through a direct comparison to see how this works. The formula Cap Rate = Discount Rate - Growth is really a simplified version of the Gordon Growth Model, which helps us quantify the value of future income.
Imagine a property with a stabilized NOI of $100,000. An investor requires a 10% return (the discount rate) to make the deal worthwhile.
- Scenario 1: No Growth. If no growth is expected, the cap rate is simply 10%. The property is worth $1,000,000. Easy.
- Scenario 2: Modest Growth. Now, let's say that same property is in a market where NOI is expected to grow by just 1% annually. The appropriate cap rate becomes 9% (10% - 1%). That small tweak pushes the property's valuation up to $1,111,111.
That extra $111,111 is the premium an investor pays to secure a growing income stream—a critical factor in markets where stable NOI growth often averages 2-3%.
This is precisely why two identical buildings in different cities can have wildly different price tags. The building in the stagnant market might offer a higher initial cap rate, but the one in the booming city holds the promise of appreciation and escalating cash flow. A low cap rate isn't always a red flag; often, it’s a sign of a high-quality asset where the real value is in the growth yet to come.
Common Mistakes To Avoid When Using Cap Rates
Relying on the cap rate formula alone, without grasping its very real limitations, can be a fast track to costly errors. The metric is a powerful first glance, but it's just a snapshot—not the full feature film of an investment. Treating it as an infallible guide is one of the quickest ways to misjudge a deal.
To protect your capital and make genuinely informed decisions, you have to know the common pitfalls that can trap even seasoned investors. Think of it as a crucial part of your risk management.
Trusting Pro Forma Numbers Blindly
One of the most dangerous mistakes is taking a seller's "pro forma" financials at face value. These numbers aren't historical facts; they're a forecast, and they almost always paint an overly rosy picture based on perfect occupancy and unrealistically low expenses.
Always, always demand the trailing 12-month (T-12) operating statements and scrutinize every single line item. A property's true performance is buried in its history, not its marketing brochure.
Ignoring Capital Expenditures
The Net Operating Income (NOI) calculation—the heart of the cap rate—deliberately leaves out Capital Expenditures (CapEx). We're talking about the big-ticket items: replacing a roof, repaving the parking lot, or overhauling an HVAC system.
They might not be daily operating costs, but they are a very real, and often very substantial, cost of owning the asset.
A property might flash a tempting 7% cap rate on paper. But if you know it needs a $200,000 roof in two years, that "return" is pure fiction. You must factor in a CapEx reserve when you analyze the overall deal, even though it lives outside the standard cap rate formula.
Forgetting to budget for these inevitable expenses can turn a cash-flowing asset into a money pit overnight.
Making Unfair Comparisons
Another classic blunder is comparing cap rates between wildly different assets or markets. A 6% cap rate on a Class A office tower in New York City means something completely different than a 6% cap rate on a Class C apartment complex in a small, tertiary market.
The two assets carry vastly different risk profiles, growth potential, and management headaches. An effective analysis demands an apples-to-apples comparison:
- Property Class: Only compare a Class A property with other Class A properties.
- Market Tiers: Keep your analysis within similar markets (primary vs. primary).
- Asset Type: Don’t compare the cap rate of a hotel to that of an industrial warehouse.
Ignoring this context is like comparing the fuel efficiency of a sports car to a cargo truck—the numbers are meaningless without understanding what you're actually measuring.
The cap rate is a fantastic starting point, an invaluable tool for that initial screening. But it should never be the only tool you use. A truly comprehensive analysis always digs deeper with metrics like cash-on-cash return, Internal Rate of Return (IRR), and a thorough discounted cash flow (DCF) model to build a defensible investment thesis.
Common Questions About The Cap Rate Formula
Even after you get the hang of the basics, a few practical questions always pop up when you start applying the cap rate formula to real-world deals. Let's tackle some of the most common ones investors run into. Think of this as clearing up the nuances you'll face during your analysis.
How Does Financing Affect The Cap Rate Formula?
This is one of the most important things to get straight: financing has zero impact on a property's cap rate.
The cap rate formula is built to measure a property's unlevered return. It shows you how the asset performs as if it were bought with all cash. Your specific loan terms—the interest rate, the down payment—will absolutely change your personal cash-on-cash return and IRR. But the cap rate itself is an independent metric, tied only to the building's income and market value.
What Is The Difference Between A Cap Rate And ROI?
It's easy to get cap rate and Return on Investment (ROI) mixed up, but they measure very different things. Think of it like a snapshot versus a feature film.
The cap rate is just a one-year snapshot of a property's income potential relative to its price, completely ignoring any loans. It's a fantastic tool for quickly comparing different assets at a single moment in time.
ROI, on the other hand, is the whole movie. It measures your total profit over your entire holding period, including appreciation, after you've accounted for every single cost—especially your initial cash investment and all your financing expenses.
A cap rate tells you about the property's performance today. ROI tells you the complete story of your investment from start to finish.
Can I Use The Cap Rate For An Unstabilized Property?
You have to be extremely careful using the cap rate formula on an unstabilized or value-add property. The formula is really only reliable for assets that are churning out a predictable, steady stream of income.
If a property's income is all over the place—say, a building in the middle of a huge renovation or still trying to find tenants—a discounted cash flow (DCF) analysis is usually a much better and more dependable valuation tool.
That said, you can still use cap rates strategically in these situations. Investors will often project a "stabilized cap rate" to estimate what the property might be worth once their business plan is finished and the income stream settles down. This helps them set a target valuation for when they plan to sell.
At Commons Capital, we help our clients navigate the complexities of real estate and other alternative investments to build lasting wealth. Schedule a consultation with our team to discuss how our private wealth management services can help you achieve your financial goals.